
Data Visualization in Webots world
Creating a robust and reliable robot is an important part of the RoboCup Rescue Simulation Demonstration Competition. When testing in Webots, our team used Data Visualization to determine how/when errors occurred. Each time we tested our robot, we wrote data from sensors such as colour, gyro, and gps into a file. Then, we used the data to find the key points and see how/what caused the errors. These errors could then be examined for strategy errors, coding errors, or noise errors. We could then create a more reliable and robust robot, since there were less challenges that could affect our robot.
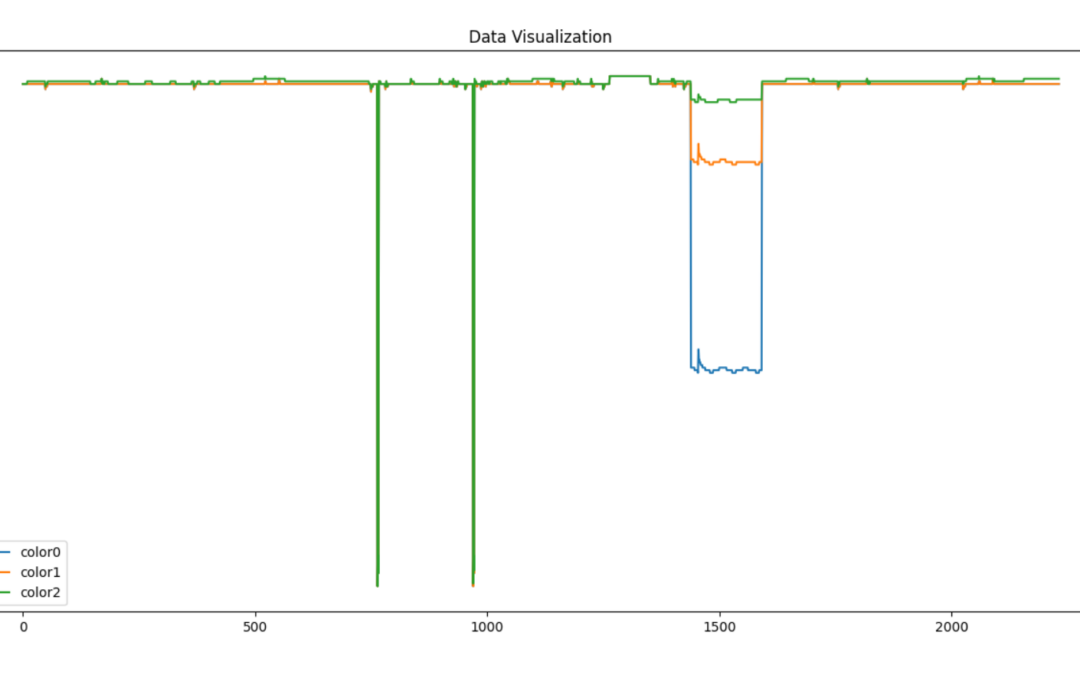
An example of the errors that we used Data Visualization to solve is seen below.
